Dragonfly Doji Candlestick: Meaning & Trading Strategy
The Dragonfly Doji candlestick is more than a simple chart pattern, it reflects a critical shift in market control driven by real-time trader behavior and order flow dynamics. Formed when sellers initially push prices lower but fail to sustain that move against strong buying pressure, it signals a potential turning point in price action. For traders who prioritize price structure over lagging indicators, this pattern can offer an early insight into possible reversals. However, its true significa
The Dragonfly Doji candlestick is not just a pattern formation on a chart, it is a mirror image of the market participants' behaviour when they are put under a certain amount of pressure. Essentially, this candlestick marks a point where sellers have been overwhelmed by buyers with enough strength to turn the price action around in the same trading day. For the price action traders who don’t wait for lagging indicators, this pattern can provide a nice early indication of a potential reversal of trend.
To properly understand it you need to look past its shape and start to understand the story it tells about market sentiment, liquidity and trader psychology.
What Makes the Dragonfly Doji Unique?
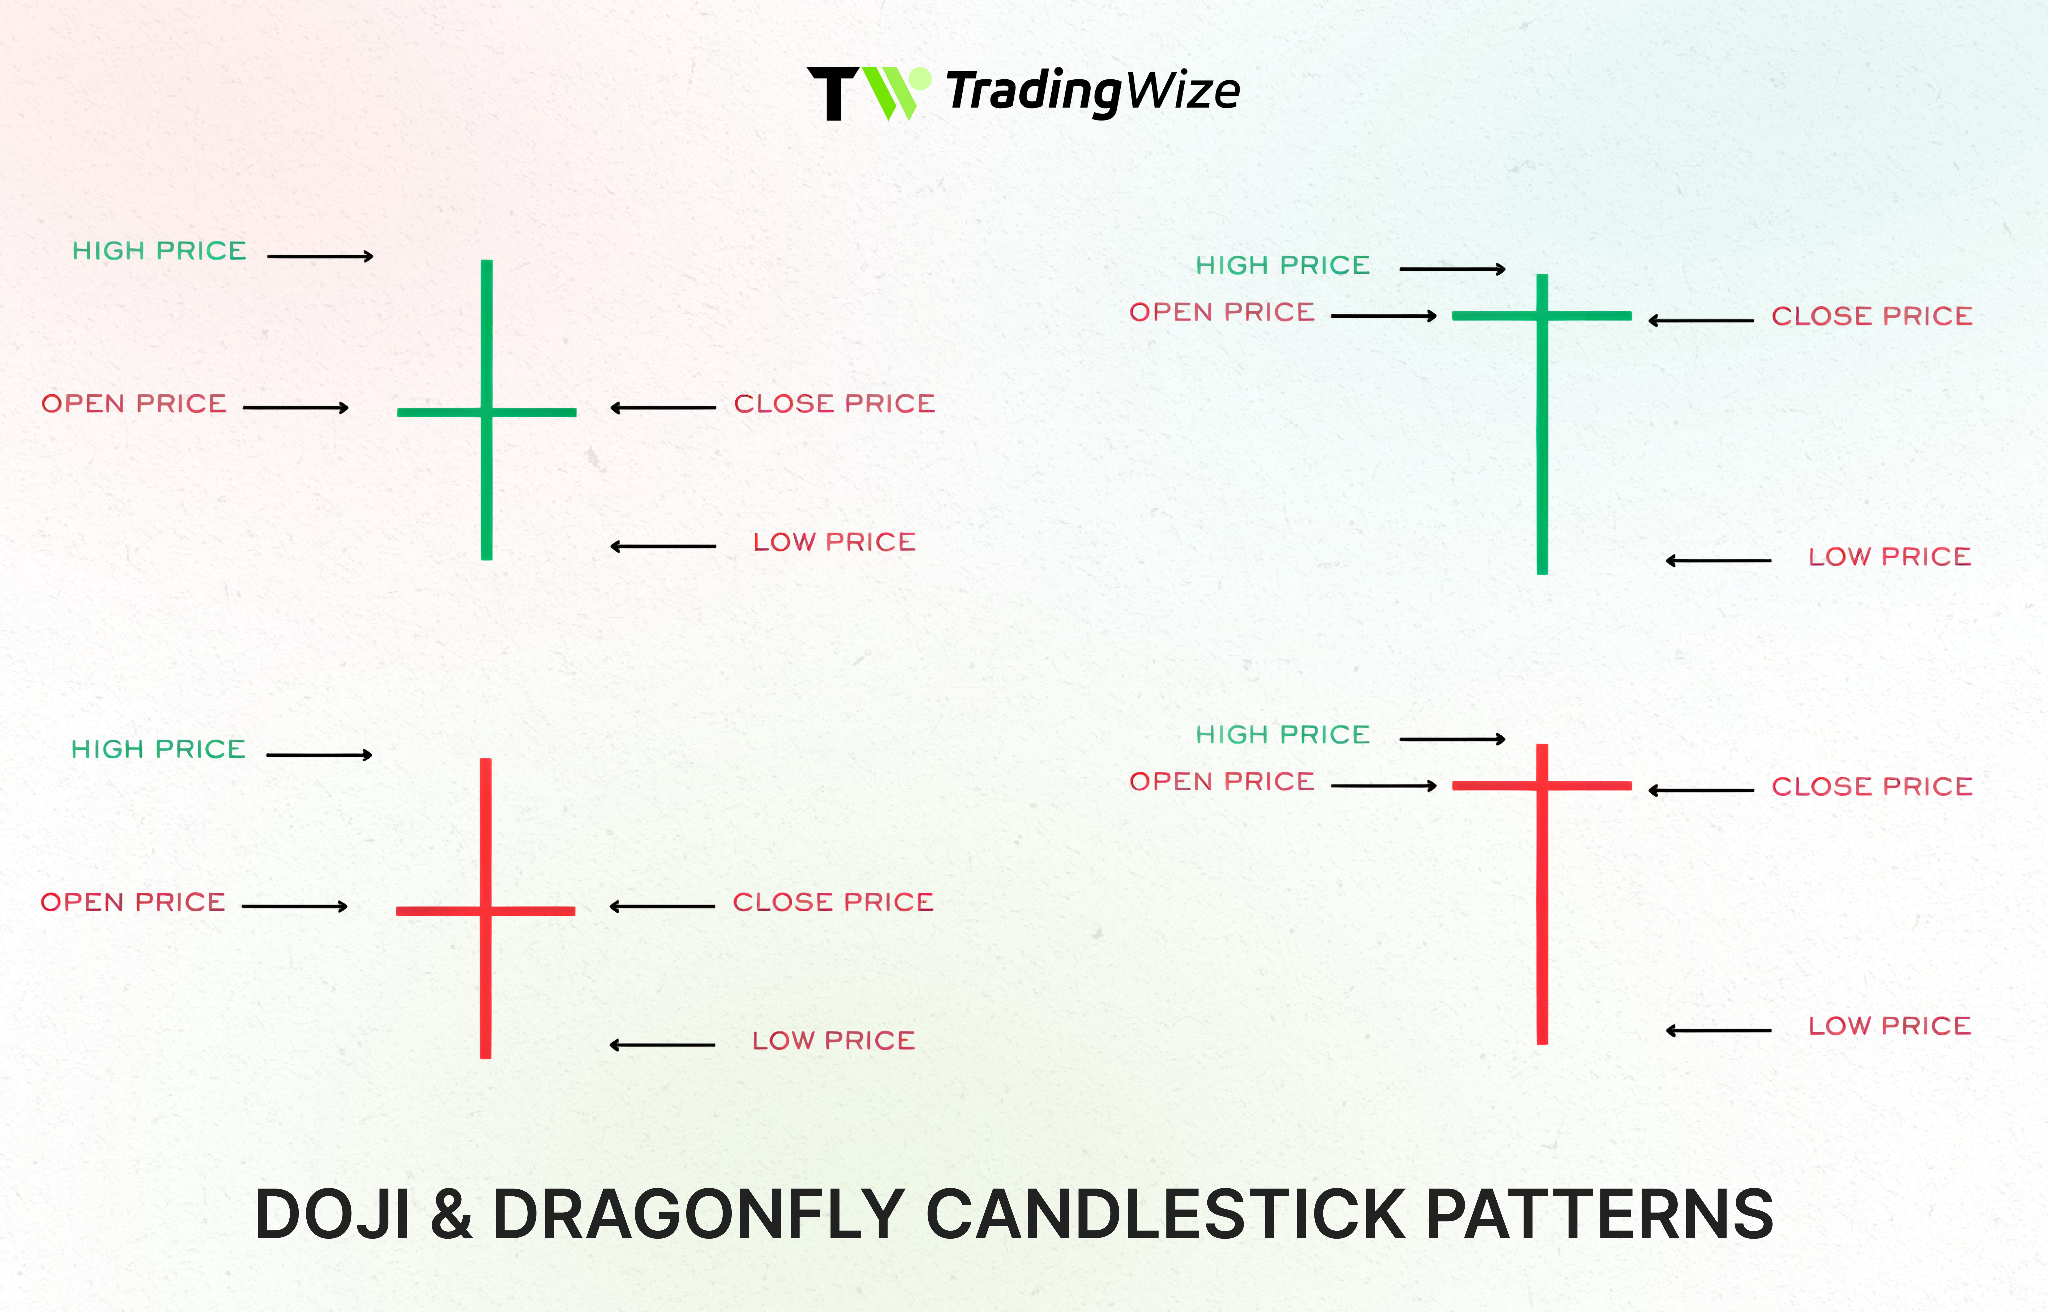
A Dragonfly Doji stands out because of its structure. The candle opens, drops significantly during the session and then climbs back up to close near or at the opening level. This creates a long lower wick and almost no real body.
Key Characteristics:
- The open, high and close are nearly identical
- A long lower shadow shows strong rejection of lower prices
- Minimal or no upper shadow
- Typically appears after a downward price movement
This structure shows the market did try to go further down, but it could not hold that move. That failure is usually the first indication of momentum shifting.
Deeper Insight into Market Psychology
To really understand the Dragonfly Doji, you need to think in terms of order flow and trader behavior rather than just candles.
At the start of the session, selling pressure dominates. This could be driven by panic selling, stop-loss triggers or continuation of an existing downtrend. As the price drops, it reaches a level where buyers perceive value. Institutional traders or smart money may begin accumulating positions at these lower prices.
As buying pressure increases, it absorbs all the selling orders in the market. Eventually, buyers push the price back up to where it started. By the time the candle closes, the market has effectively rejected the lower price range.
This shift from selling dominance to buying strength is what gives the Dragonfly Doji its potential bullish implication.
Importance of Context in Trading
One of the largest misconceptions for beginners is thinking that every Dragonfly Doji is a reversal. In reality, the pattern is only relevant when it occurs in a certain place.
For instance, if this pattern develops after a long down move and close to an important support, it could mean that the sellers are getting tired. On the other hand, if it appears randomly in the middle of a sideways market, it carries very little significance.
High-Probability Context:
- After a clear and extended downtrend
- Near historical support levels
- At demand zones where buyers previously entered
- Around psychological price levels
Low-Probability Context:
- In choppy or sideways markets
- Without any nearby technical structure
- During low trading volume periods
Professional traders rely so much on context that it has the effect of removing the weaker signals and magnifying the stronger setups.
Step-by-Step Trading Strategy
For utilizing the Dragonfly Doji effectively you need a well structured strategy with confirmation and risk management.
1. Identify the Setup
Look for the pattern forming after a decline and near a key support level. This combination increases the probability of a reversal.
2. Wait for Confirmation
One candle is not enough. Wait for the next candle for verification of the bullish momentum. This could be:
- A strong bullish candle
- A break above recent resistance
- Increased buying volume
3. Plan Your Entry
Once confirmation appears, you can enter the trade. Conservative traders wait for the confirmation candle to close, while aggressive traders may enter earlier for better risk-reward.
4. Set Stop Loss
Place your stop loss below the low of the Dragonfly Doji. This level represents the point where the pattern fails.
5. Define Your Target
Targets should be based on structure, not guesswork. You can use:
- Previous resistance levels
- Risk-reward ratios (such as 1:2 or 1:3)
- Moving averages or trendlines
Many traders use platforms like TradingWize to simulate these entry, exit, and stop-loss strategies before applying them in live markets.
Practical Example Explained
Think about a stock that is gradually falling over days. The price is falling into a strong support area in which it previously bounced. At this point, a Dragonfly Doji appears.
Sellers drive the prices down during the session but buyers absorb the selling pressure and pull it up. The following day the price gaps up and continues to the upside to form a bullish confirmation bar.
In this case traders take the pattern as an indication that the downtrend may be finished. They get in long, put a stop loss below the Doji’s low and take profits at the next resistance. This systematic method will keep the risk down and the potential rewards high.
Common Pitfalls and How to Avoid Them
Even though the Dragonfly Doji is a powerful signal, misuse can lead to losses.
Common Mistakes:
- Entering trades without confirmation
- Ignoring the overall market trend
- Placing stop loss too tight or not at all
- Trading the pattern in isolation
- Overtrading low-quality setups
Steering clear of these mistakes takes discipline and a well defined trading plan. Trading well is not so much a matter of identifying patterns as it is a matter of playing them right.
Enhancing Accuracy with Confluence
Relying on a single signal is rarely enough in trading. Combining the Dragonfly Doji with other tools increases the probability of success.
Useful Confluence Factors:
- Support and Resistance: The most important factor
- RSI Indicator: Oversold conditions strengthen the reversal signal
- Volume Analysis: Higher volume indicates stronger buyer participation
- Moving Averages: Help confirm trend direction and dynamic support
When multiple signals align, the setup becomes significantly more reliable.
Intraday vs Swing Trading Use
It can be used across different trading styles, but its effectiveness varies.
For intraday trading, the pattern works best in highly liquid markets with clear trends. Traders need to act quickly and rely on additional confirmation like volume spikes or breakout levels.
For swing trading, the pattern is often more reliable because it reflects broader market sentiment. When combined with daily or higher timeframe analysis, it can provide strong reversal signals.
Conclusion
This is a strong visual expression of price rejection and changing hands of market control. It marks a pivotal point where the sellers have lost their control and the buyers are taking over. But its real value is not in the pattern itself, but rather in how the pattern is used as part of a bigger trading strategy.
Context traders who have the patience to wait and the risk management to survive can use this pattern to help identify high odds opportunities. Conversely, those who take the example at face value and argue from that perspective without scrutiny, will probably have very erratic results.
Read our latest news
The Dragonfly Doji candlestick is more than a simple chart pattern, it reflects a critical shift in market control driven by real-time trader behavior and order flow dynamics. Formed when sellers initially push prices lower but fail to sustain that move against strong buying pressure, it signals a potential turning point in price action. For traders who prioritize price structure over lagging indicators, this pattern can offer an early insight into possible reversals. However, its true significa